Wash, Rinse, Repeat

It is getting a little tiring watching the news cycles about the economy and European issues.  It is like 4 months of the same song, over and over again.  Tiring to say the least.

A few weeks ago, we dipped our toes in and added exposure to the market.  After a quick jump we pulled that new exposure off.  The market (S&P 500) was able to break through minor resistance 1320 area.  However, it now looks like we are stalling at heavier resistance around 1350-1360.  This may be it for this run.  It does not look like the top of the trading range for the summer will be near the year highs around 1400.  If the bulls are to have a chance, we have to get prices up past 1365.  However it just doesn’t look like there is enough steam to push that high.

Volume has started to fall again on the this price rise.  Oil did not bounce at all!  Not only did not bounce, but this morning in early trading, fell below its recent low.  Additionally the bond market is not signalling money is moving to stocks.  The U.S. Treasury 10 year note yield cannot seem to break above 1.7%.  With oil, bonds and market volume not confirming the 2 week price rally, we are highly doubt the run can continue.

We remain heavy in cash after taking off the new exposure we added when prices were near the 200 day moving average.  Capturing half of the price move was good enough.  We still had some exposure to the market, although at low levels.  On Tuesday, we added a small, short-term, inverse hedge for some client portfolios (based on risk tolerance).

On another note, I attended the Mid Atlantic Hedge Fund Association’s round table discussion in Philadelphia last week.  The discussion was on opportunities in Europe.  Of the three panelist, 2 were bullish and one bearish.  The bull case was basically it will take Europe more time than the U.S. in 2008 to realize how much liquidity needs to be put into the banking system, but they will get around to it eventually.  That was the thrust of the bull case, period; a central bank rescue!  The bearish panelist felt he would be correct, European Central Bank bail outs or not.  His problem was with long-term growth.  Bailouts would simply borrow from the future and be a longer term drag on growth.  In fact, keeping interest rates low kills banks future earnings and takes them longer to earn their way out of balance sheet issues.  So how can one buy bank equities when future earnings would be impaired.  While all the circumstances are not exactly the same, the policy reaction in early 90’s Japan, late 00’s U.S. and now Europe are pointing toward creation of stagnant growth for a decade or more.  None the less, and interesting discussion and worth the effort to attend.

No Man’s Land

The S&P 500 ($SPX) successfully held the 1355 – 1360 support area.  Once again, on the bounce last week, the 50 day moving average (blue) did not provide any resistance.  Since the 1355 – 1360 area of support, there was no need to further reduce exposure.

The risks now seem equally weighted for the next few weeks for a continued rally, further correction or tight range bound trading.  What is a sensible, risk based approach to committing your capital?  Right now, do nothing.  As long as prices stay above the 1355 area, there is no reason to sell.  However, until the market can prove it can rally above 1420, why risk new capital? (orange delineations of range)

Occasionally I will turn on financial media coverage and see what some of the “experts” are saying.  Fast Money last night on CNBC had a technical analyst give his take on where markets could be heading.  He had a target of about 1250 on the $SPX, before mid summer.  Personally, I am not that bearish when it comes to a correction.  Our forecast is for a correction to hold around 1285 – 1310 area (green delineated area).  Over the next 3-6 weeks the 200 day average (red) can drift up toward the bottom of this area.  With two technical supports, this should be a good enough bottom to attract buyers.  Maybe a dip below as a “bear trap.”

Conversely, there is not much to compel me to think the market will rally past 1420 before late summer.  Technically or fundamentally.  First we have to print above 1420.  Second there is a lot of seasonality to overcome.  Third, Operation Twist is ending and the economic news has not been bad enough to force Bernanke’s hand to try and add more stimulus.  Additionally, with the  Presidential election, one can guess there is a lot of market participants waiting to see what the mood of the electorate is before committing to more exposure to the markets.

This week will be a busy week.  Chicago tomorrow and Atlanta Thursday through Saturday.  Good trading!

Just Plain Scary

Sometimes it is just plain scary how right one can be.  Markets have a way of humbling everyone from time to time.  So I almost never brag.  Cautiously I take a look at last week’s post, A Bridge Too Far, and see that the S&P 500 did just as we expected.  The market continued its correction, the 50 day moving average provided no support at all, and the bounce today failed at just below the 50 day average!

From our previous blog posts you may remember that the $SPX 1345 to 1360 area, we felt, was a critical support resistance area.  Sure enough the $SPX battled in late February to break through and then tested and held the lower end of the support area.  The rally lasted, but rolled over short of a longer term resistance area around 1440.  Now what do we do?!

In our opinion, we do not think the price action is very bullish.  If the support cannot hold here, we think the probabilities of a fall back to the 200 day moving average is in play.  Roughly another 6% correction.  The only way to negate a probable move to the 200 day average is for the bounce here to forcefully take out the 50 day average and have decent follow through for a couple of sessions.  Maybe, just maybe a trading range will form with 1350 being the bottom of the range.  Our outlook is for the bearish outcome to have the higher probability, a trading range with a lower end of around 1350 to have a lower probability, and a continuation of the rally to new highs above 1420, the least likely outcome.  Sorry Champ!  Wish we had better news.

New Definitions of Irrational Exuberance

Remember the good old days when Alan Greenspan uttered the famous “Irrational Exuberance”  The following decade and a half showed that Mr. Greenspan was not even close to describing the condition many markets found themselves.  So what do we have today?  Irrational exuberance in the stock market?  Or the perfect low interest rate, slow but steady growth environment stock prices seem to love?

Global capital will always flow to the least risky environment.  Notice I did not say risk free, rather, least risky.  The U.S. has its own precarious growth story and government debt issues (understatement I know).  The other large economies of the world are struggling even worse though.  Europe is in a sovereign debt mess. Asia is dealing with a slowdown in China.  Slow, below average growth doesn’t looks so bad here.  Add global central bank liquidity injections on an unprecedented level, and why shouldn’t stock prices drift higher?  But how high?

One important clue is the flight to safety.  Are market participants moving to larger and larger cap stocks?  Market tops start when small, then mid-cap stocks underperform the large caps.  Finally, large caps give up moving higher as well.  Let’s take a look at the small and medium cap stocks.

The Russell 2000 Small Cap Index has broken through resistance.  If we can hold above the resistance level (orange line) for a handful of sessions, we should be ok.  There is some concern about the negative divergences showing up in the RSI and MACD.

The MDY, representing mid cap stocks shows similar performance; break out past resistance, while negative divergences are building.  As long as prices hold up above resistance, it is hard to say the major averages will run out of steam.  The appetite for paper (stocks) is still there.  I know many are worried about volume, as we are.  But price trumps all other indicators.

Looking at the S&P 500 ($SPX), prices keep marching higher, and the negative divergences have worked their way back to neutral.  Volume has even stabilized.

Overall, we are getting worried about the sustainability of the bull run.  However, the price breakdown should be signaled by a breakdown and weakening chart in small and mid cap stocks.  It is still early since we only have negative divergences for the small and mid cap stocks, not price breakdown yet.

We Made It!

Ok, we are here!  Where is “here?”  The market (S&P 500 represented by the $SPX) has clawed al the way back to almost last year’s high.  Whew…  the August disaster, Japan earthquake, even Greece… no, Greece and the rest of Europe are still on table… all seem like distant memories!  Does any of this matter anymore?  Let’s see.

Prices settled at 1395 on the $SPX yesterday, just above the low end of what looks to be a major resistance area.  The resistance is from approximately 1340 to 1365.  Three attempts last year to break above this failed, including the massive failure in August.  Price rules for sure, but who is buying?  Fewer and fewer participants seem to be.  Volume is falling.  In fact, Monday the 6th was the market’s lowest volume in 10 years for a non-holiday week.  MACD is also non-confirming, showing a negative divergence.  RSI is one of the very few indicators showing a confirming movement.  This is because the RSI is a price based indicator.  There is no weighting of other movements of price over time.

Now would be to lighten your stock exposure to the lowest level you personally are comfortable with.  If we do break above 1365 for a few sessions, you can get back in with only a small amount of missed opportunity.  Otherwise, we are due for a correction you may have to absorb if we can’t move higher.

The Quest for Assurance

As humans we all want assurances for almost all aspects of life.  As a whole, we seek stability.  It would seem that is where we are the most comfortable.  The stock market is no exception.

The market, as represented by the S & P 500 Index ($SPX) has finally showed some price weakness the last four session.  This morning the futures are showing a strong open.  But will it hold?  Currently there are very mixed signals as seen on the chart below.  We have a confirming Relative Strength Index (indicator at the top of the chart).  But MACD and Volume are very worrisome.

For new allocations to stocks we would like to see either a break out above major resistance around the 1350 area (orange rectangle) or a correction and hold of the 1280-1285 area.  In between those price levels, we see too much risk to make new commitments.  Needless to say the next few sessions will be interesting to watch this battle unfold.

While watching Oil prices ($WTIC), we see another non-confirmation of the market prices rising.  Oil prices have been range bound since the latter half of October.  Negative divergences are building in primary indicators like RSI, MACD, and contract volume.  We can stay range bound between $91 and $104 per barrel for a while.  Extreme caution would be warranted if we break below the 200 day moving average (red curve on lowe chart).  Conversely, a break above the $104/bbl price, along with a break above resistance for the S&P 500, as discussed above, would be very bullish in our opinion!

This week is an exciting week here in Indianapolis!  It is the Super Bowl!!!  The only damper to the excitement here is that our own Colts are not here.  Attached are a couple of pictures of the scene on the ground here.  I have to laugh because there was a lot of worry about the weather, but yet the average temperature this week is warmer than what Dallas experienced last year!  The game should be one for the books with two outstanding teams…enjoy!

Didn’t Think You Gambled?

First of all my apologies.  Between the holiday season and the start of a couple of new projects, I have neglected to post our market commentary here in a month!  Since we want this to be at least weekly, my daughter would say “fail!”  So with no further delay…

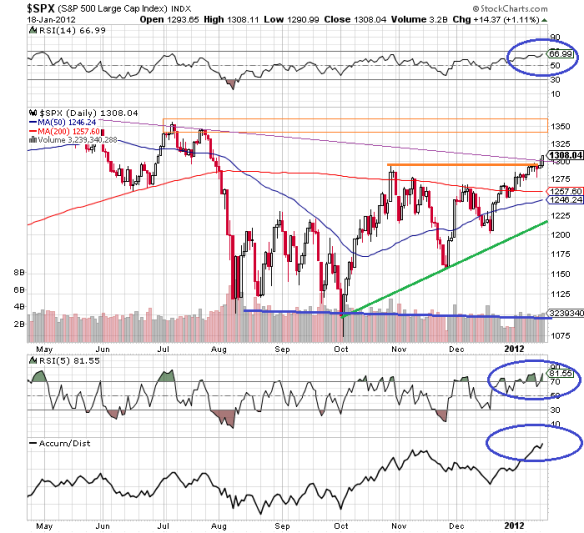
Let’s look at the market environment.  As a reminder, our reference to the “market” refers to the stock market represented by the S&P 500 Index.  There is an old adage that if you cannot tell who the fool is at the table, when gambling, you are probably it.  For many investors, we guess they are starting or already feel this way.  After a decade of going nowhere when it comes to capital gains, getting scared to death this last summer, many are now feeling the market is heading up without them.  Looking at a variety of measurements and a few fundamentals will guides.  Up front, we have been underweight equities for several months.  Our patience is wearing thin as well.  However, we need to see better prices before adding to equity positions.  Using the chart below, which is click-able to expand, we can see some of the risks that are not readily apparent.

Price alone, we would think that all is well with the world and the economic recovery is accelerating to a new cycle of growth and higher employment!  So if you rode this train, fully invested, good for you!  (Sarcastically I would say the same people also enjoyed the ride down from the end of July, not getting back to even.)  On the positive side, the S&P 500 Index has pushed up through a lot of resistance.  The 50 day moving average (blue curve), 200 day moving average (red curve), and the down trend of peak prices (magenta line moving down from left to right) have offered only a few setbacks to the price advance.  Now the next resistance point is all the way back up at the 1350 area, which is where we were before the August slide.  From a news perspective, the U.S. has not fallen back into a recession, Europe did not “meltdown,” and earnings seem to be doing well.

Now the other side of the coin.  The rally since early October has been accompanied by steadily declining volume (blue line).  This is not healthy.  One of the reasons there is slowing volume is that the selling is declining, which is different from buying increasing.  How do we know.  NYSE short interest, you know the people who sell stocks they do not have, has steady declined to a multi-month low, to the low-end of normal ranges.  So the selling pressure has lifted, not new buying.  Additionally three other indicators are signaling a topping point (blue circles).  First the longer term Relative Strength Index (RSI) at the top of the chart is nearing a topping point.  It can go higher, but as long as we are near or above the over-bought area toward the top of the indicator, the odds decrease that the move can be sustained.  The medium term RSI, near the bottom of the chart, is also at a sustained oversold condition.  A condition that we have not seen since December 2010 through mid February 2011.  That run helped push us to the market high of 2011.  So we are at or near an oversold peak, but yet have not recovered fully in price to May 2011 levels.

Not to pile on, but we need to point out the 200 day moving average (red curve), has not yet turned up, and the Accumulation/Distribution line (bottom of chart) is at a 3 year peak!  Again, without a corresponding peak in prices.  Fundamentally, signs are showing up that the economy is not accelerating.  There are mixed signals for growth and contraction.  Europe is not fixed.  If Europe does not enter a banking/liquidity/credit crisis, then at the very least, the increased European Central Bank borrowing and liquidity injections will only prove to be a drag on future growth.  (Yes borrowing and printing money only takes away from growth in the future.  But since it is too difficult to quantify, the temptation to try to stimulate now is to great for most governments and central banks to overcome.)  Additionally there is political uncertainty in the U.S. surrounding the sustainability of borrowing $1 TRILLION or more of new debt annually.

All that said, it is hard to put new money in the market at this point.  To launch as sustained multi-quarter bull market, we need a healthy pull back.  Even a correction back to the 200 day moving average (red curve) would be a start.  We would look at that opportunity to increase stock market exposure.  Our favorites would still be dividend paying equities or dividend heavy ETFs (Exchange Traded Funds), with an overweight position in energy.

As always, if you have any questions, or would like to speak with us, please contact me by email.  scott.noble(at)terniongroup.com

Red Alert!

After a strong rally in only 7 sessions we are back at the bottom side of the 200 day moving average on the S&P 500 Index.  This is not the 3rd attempt to break through since late October.  We are warning extreme caution at this point.  Let’s look at why.

The bullish case is pretty easy.  The hope is that if Europe can fix its debt crisis, then global growth can continue to chug along and a recession can be avoided in most, if not all of the leading economies of the world.  Each new headline of the latest solution seems to push the market up a couple of percent in a session.

The bearish case is getting pretty long here.  On a relative strength basis, short and medium term indicators are extremely over-bought.  The longer term relative strength indicator is in the upper part of mid range.  So not much juice here to keep a rally going.  Buying volume is still anemic.  Each of the attempts to break through the 200 day moving average has been weaker successively.  The first two actually closed above the moving average with strong sessions.  Only to be met with powerful selling days.  Now we have only weak rally session which did get an intra day print above the 200 day moving average, but fell back by the close.  Each of these attempts has also been a lower price high than the previous.  Also signaling a weakening demand for equities.

The probability lies with another failure here at trying to break through the 200 day moving average.  If we can break above, look for a strong move toward $SPX 1300.  If we fail, as we are anticipating, then we should find the first support at the 50 day moving average around 1220.

-What will happen on the third time?

Hope Fades!

The hope many had that the 200 day moving average on the S&P 500 Index is now gone.  We broke through for a couple of days and even re-tested.  However the rout of the last few weeks has taken away any idea of challenging the 2011 high.

The correction is getting disturbing again since supports are not holding up.  Even the 50 day moving average, which is rising did not provide any rest.  At the moment of this writing, we are testing the support at the 1175 area near the open.  If 1175 does not hold, there is not much good news.  The next support is 1120 area.  Unless there is some high volume selling exhaustion before 1120, that would be the target for a sustained bounce.

There are fairly good odds we can bounce here.  First we are at a minor support area.  Second, seasonally, a holiday rally is due.  Third, we are very oversold on short and medium term relative strength.  Long term relative strength is near a low.  For longer term relative strength to go lower, we will need some bounce to relieve the short-term oversold condition.  Then we can go lower.  And that is assuming we go lower in an order fashion.

Speaking of fashion, Europe is a mess.  The news is driving the daily fluctuations of prices.  In managed accounts, we have been holding a lot of cash.  While it is possible to hedge, why put clients through paying for hedge positions?  This week some cash has been put to work at these prices.  But we are very cautious still.  All in all the second half of 2011 has been a roller coaster that most investors have not experienced.  Patience is tested since we have been conditioned by the industry to “always have your money working for you.”  However, waiting to pounce on good prices is the most prudent thing to do.  Even if it takes a few months!

On to energy.  Oil broke out above its 200 day moving average a couple of weeks ago, peaked and now sits back on the 200 day moving average.  For the next few sessions, oil will probably follow equities.  Depending on the “solutions” by central banks to the Euro crisis, oil may diverge again.  If oil breaks its 200 day moving average, look for support around the rising 50 day moving average.

Bull Stampede! Or is it?

My apologies for taking too much time between posts.  While a lot has happened, in reality not much has happened.  Let’s recap…

Support for the market ($SPX; S&P 500) was around 1120.  Two weeks ago, we closed below that level.  Being oversold we rallied.  Instead of rallying just to relieve the oversold condition and falling further, we rallied all the way back to extremely overbought!  And on a closing basis, reached above 1220, which looks bullish.  Even the 50 day moving average didn’t even prove to be any resistance all.

There are two forces at work here.  Those that think another recession, or we never left the first one from 2008, will push economic activity lower, with Europe sovereign and bank debt as a catalyst.  Or you think Europe will save itself by acting more like the U.S. in 2008 and use liquidity in several forms to keep things running and more than likely keeping a recession away.  In a moment, I will comment on Europe.  For now, we still look at the technical picture.  I’d rather watch how money is actually moving, than by what the news and commentators say.

The close above 1220 was not convincing enough above the resistance to show that we are through this price point.  Support and resistance are areas, not hard lines.  However the break below support was convincing, 1120 did not hold buyers interest.  But you have nervous shorts as well.  All it takes is for a credible European news flash and the dip buyers will come out in force.  The roughly 100 point $SPX rally, again, was on declining volume.  Not good for the bulls.  Bulls need to hope we hold at the 50 day moving average if they want another shot at breaking out of the 1220 area and bring the 200 day moving average back into play.  The bears do not need much help.  Just let the existing trend, which started at the end of April continue.  Although the swings are now a hundred $SPX points, we are still looking at a bear flag or a massive consolidation before going lower.

Regarding Europe; I was attending a hedge fund conference in the East.  There was a panel discussion by hedge fund managers about the crises.  One of the three was based in Europe and was very helpful about the sentiment over there.  Here is the deal, Greece is big deal, not because they could trigger a larger banking crises themselves, but rather be a catalyst for exposing the problems in Spain.  And Spain really is “too big to bail” out!  If Greece issues are settled, the best hope is that the economy gets better and Spain can use improved tax receipts to get past its debt issues for now.   And I say “for now” because there really isn’t a real fix until governments stop borrowing to pay for current expense on a continual basis.  At some point, debt service has to remain manageable, even in times where reduced tax receipts due to economic slowdown pinch the budget.

If we break the 50 day moving average to the downside on this correction (starting today as of the writing), then look for a retest of the lows and possibly a fall to the $SPX 1050 area.  If we hold, there is a chance we do break out and challenge the 200 day moving average.