Don’t Let Your Money Burn a Hole in Your Pocket

How many times did you hear this as a child?  Too many!  But it is true.  Whether we spend, save, or invest, we feel our money constantly has to be doing something.  Sometimes, instead of working, money needs to patiently rest.

If we go back to the end of 2007, money should have rested 18 months before going back to work!  Having capital preserved was more advantageous than putting it risk.  Right now, we are in an environment where there really is no driver that excites us to put more capital at risk.  The 20-30% exposure we have for managed accounts is still long.  A small inverse ETF hedge was closed yesterday for a small profit.  This is all the interest we have.  While many may say we are under-invested, I ask why would we put more capital at risk?

Until the market can hold above the 1355-1365 area on th S&P 500, why should have more interest in stock exposure?  We did push above that level and held for 2 days before falling below that level the last few sessions.  Selling the remaining investments or adding an inverse hedge doesn’t excite us either.  Since the beginning of June the S&P 500 has a nice little up-trend in place.  Currently we are testing the lower edge of the up-trend.

So for now, we are wimps!  Holding pat at about 1/3 of bullish exposure and being patient could easily prove to be the most prudent action.  Once we can hold above 1355-1365 more exposure is warranted.  Pushing past 1420 would make us bullish.  Conversely, falling below the 200 day moving average at about 1305, and again not holding 1285, would make us very bearish.

Wash, Rinse, Repeat

It is getting a little tiring watching the news cycles about the economy and European issues.  It is like 4 months of the same song, over and over again.  Tiring to say the least.

A few weeks ago, we dipped our toes in and added exposure to the market.  After a quick jump we pulled that new exposure off.  The market (S&P 500) was able to break through minor resistance 1320 area.  However, it now looks like we are stalling at heavier resistance around 1350-1360.  This may be it for this run.  It does not look like the top of the trading range for the summer will be near the year highs around 1400.  If the bulls are to have a chance, we have to get prices up past 1365.  However it just doesn’t look like there is enough steam to push that high.

Volume has started to fall again on the this price rise.  Oil did not bounce at all!  Not only did not bounce, but this morning in early trading, fell below its recent low.  Additionally the bond market is not signalling money is moving to stocks.  The U.S. Treasury 10 year note yield cannot seem to break above 1.7%.  With oil, bonds and market volume not confirming the 2 week price rally, we are highly doubt the run can continue.

We remain heavy in cash after taking off the new exposure we added when prices were near the 200 day moving average.  Capturing half of the price move was good enough.  We still had some exposure to the market, although at low levels.  On Tuesday, we added a small, short-term, inverse hedge for some client portfolios (based on risk tolerance).

On another note, I attended the Mid Atlantic Hedge Fund Association’s round table discussion in Philadelphia last week.  The discussion was on opportunities in Europe.  Of the three panelist, 2 were bullish and one bearish.  The bull case was basically it will take Europe more time than the U.S. in 2008 to realize how much liquidity needs to be put into the banking system, but they will get around to it eventually.  That was the thrust of the bull case, period; a central bank rescue!  The bearish panelist felt he would be correct, European Central Bank bail outs or not.  His problem was with long-term growth.  Bailouts would simply borrow from the future and be a longer term drag on growth.  In fact, keeping interest rates low kills banks future earnings and takes them longer to earn their way out of balance sheet issues.  So how can one buy bank equities when future earnings would be impaired.  While all the circumstances are not exactly the same, the policy reaction in early 90’s Japan, late 00’s U.S. and now Europe are pointing toward creation of stagnant growth for a decade or more.  None the less, and interesting discussion and worth the effort to attend.

Who Will Blink First

It has been a few weeks since my last post.  Previously we stated that we were very cautious and had even reduced exposure to the market by a significant amount.  The correction almost touched out forecast low near the 200 day moving average on $SPX (S&P 500), before bouncing the last few days.

Depends on who blinks first, the fearful bears or the greedy bulls.  This is no comment on the value those attributes, but rather the nature of the market itself; fear and greed.  On a very short-term basis, the 3 days up have relieved the oversold condition.  Subsequently the volume was lower on the bounce.  The longer term relative strength is off of the lows and susceptible to going either direction.

Our analysis shows a slight edge to more upward movement in prices.  Resistance comes in around the 1345-1350 area (orange line).  We should be ok until then.  It is hard to allocate more capital though, for only a 2-3% move.  If we can clear the 1350 area, then the risk is lower and more exposure could prove to beneficial.  Above 1350, there is room to run to around 1400.

Failing to get to the 1350 area or turning back down, would likely give us a re-test of the 200 day moving average and minor support around 1290.

Patience is key!  Don’t get too itchy to be over exposed.  Deflationary cross currents cause periods where it is more important to preserve capital than it is to reach to far for a gain.  The next update will include energy.  Off for a few days of a much needed rest with a good friend visiting from out of town.  Enjoy the weekend everyone!

No Man’s Land

The S&P 500 ($SPX) successfully held the 1355 – 1360 support area.  Once again, on the bounce last week, the 50 day moving average (blue) did not provide any resistance.  Since the 1355 – 1360 area of support, there was no need to further reduce exposure.

The risks now seem equally weighted for the next few weeks for a continued rally, further correction or tight range bound trading.  What is a sensible, risk based approach to committing your capital?  Right now, do nothing.  As long as prices stay above the 1355 area, there is no reason to sell.  However, until the market can prove it can rally above 1420, why risk new capital? (orange delineations of range)

Occasionally I will turn on financial media coverage and see what some of the “experts” are saying.  Fast Money last night on CNBC had a technical analyst give his take on where markets could be heading.  He had a target of about 1250 on the $SPX, before mid summer.  Personally, I am not that bearish when it comes to a correction.  Our forecast is for a correction to hold around 1285 – 1310 area (green delineated area).  Over the next 3-6 weeks the 200 day average (red) can drift up toward the bottom of this area.  With two technical supports, this should be a good enough bottom to attract buyers.  Maybe a dip below as a “bear trap.”

Conversely, there is not much to compel me to think the market will rally past 1420 before late summer.  Technically or fundamentally.  First we have to print above 1420.  Second there is a lot of seasonality to overcome.  Third, Operation Twist is ending and the economic news has not been bad enough to force Bernanke’s hand to try and add more stimulus.  Additionally, with the  Presidential election, one can guess there is a lot of market participants waiting to see what the mood of the electorate is before committing to more exposure to the markets.

This week will be a busy week.  Chicago tomorrow and Atlanta Thursday through Saturday.  Good trading!

Just Plain Scary

Sometimes it is just plain scary how right one can be.  Markets have a way of humbling everyone from time to time.  So I almost never brag.  Cautiously I take a look at last week’s post, A Bridge Too Far, and see that the S&P 500 did just as we expected.  The market continued its correction, the 50 day moving average provided no support at all, and the bounce today failed at just below the 50 day average!

From our previous blog posts you may remember that the $SPX 1345 to 1360 area, we felt, was a critical support resistance area.  Sure enough the $SPX battled in late February to break through and then tested and held the lower end of the support area.  The rally lasted, but rolled over short of a longer term resistance area around 1440.  Now what do we do?!

In our opinion, we do not think the price action is very bullish.  If the support cannot hold here, we think the probabilities of a fall back to the 200 day moving average is in play.  Roughly another 6% correction.  The only way to negate a probable move to the 200 day average is for the bounce here to forcefully take out the 50 day average and have decent follow through for a couple of sessions.  Maybe, just maybe a trading range will form with 1350 being the bottom of the range.  Our outlook is for the bearish outcome to have the higher probability, a trading range with a lower end of around 1350 to have a lower probability, and a continuation of the rally to new highs above 1420, the least likely outcome.  Sorry Champ!  Wish we had better news.

New Definitions of Irrational Exuberance

Remember the good old days when Alan Greenspan uttered the famous “Irrational Exuberance”  The following decade and a half showed that Mr. Greenspan was not even close to describing the condition many markets found themselves.  So what do we have today?  Irrational exuberance in the stock market?  Or the perfect low interest rate, slow but steady growth environment stock prices seem to love?

Global capital will always flow to the least risky environment.  Notice I did not say risk free, rather, least risky.  The U.S. has its own precarious growth story and government debt issues (understatement I know).  The other large economies of the world are struggling even worse though.  Europe is in a sovereign debt mess. Asia is dealing with a slowdown in China.  Slow, below average growth doesn’t looks so bad here.  Add global central bank liquidity injections on an unprecedented level, and why shouldn’t stock prices drift higher?  But how high?

One important clue is the flight to safety.  Are market participants moving to larger and larger cap stocks?  Market tops start when small, then mid-cap stocks underperform the large caps.  Finally, large caps give up moving higher as well.  Let’s take a look at the small and medium cap stocks.

The Russell 2000 Small Cap Index has broken through resistance.  If we can hold above the resistance level (orange line) for a handful of sessions, we should be ok.  There is some concern about the negative divergences showing up in the RSI and MACD.

The MDY, representing mid cap stocks shows similar performance; break out past resistance, while negative divergences are building.  As long as prices hold up above resistance, it is hard to say the major averages will run out of steam.  The appetite for paper (stocks) is still there.  I know many are worried about volume, as we are.  But price trumps all other indicators.

Looking at the S&P 500 ($SPX), prices keep marching higher, and the negative divergences have worked their way back to neutral.  Volume has even stabilized.

Overall, we are getting worried about the sustainability of the bull run.  However, the price breakdown should be signaled by a breakdown and weakening chart in small and mid cap stocks.  It is still early since we only have negative divergences for the small and mid cap stocks, not price breakdown yet.

Flying High

Last week was a busy week preparing for a registration exam and then a couple of days of needed R&R. Needless to say I did not get a chance to update the blog for the week.  The nice thing was that the market moved just like we forecasted.  Now we are off the races!

As a quick recap, we felt the move two weeks ago above the 1360 area of the S&P 500 ($SPX) was bullish.  The key would be on the pull back after reaching that high.  Sure enough we corrected, which was long overdue, but only back to the bottom of the resistance area around 1340.  Since then we have launched back up through the resistance area, even pushing through the nice round number of 1400 on the $SPX!  The rally has been so strong, I would dare say it looks like we are pushing to far too fast.  Since we are so over-bought on short, medium and longer term indicators, I would not be surprised to see a correction back near 1375.  A bounce there would extend our bullish outlook.  A failure at 1375 and we would begin trimming longs.

Looking at oil, we decided this week to use the chart for Brent Crude, rather than West Texas Intermediate, which is priced at Cushing, OK.  The price of Brent reflects price discovery of a global supply/demand environment.  Currently West Texas is reflecting dampened demand here in the United States (despite reports of an improving economy).  Brent is butting up against resistance at $126 per barrel.  As long the price hangs up here above the $121 area, we can break out and push higher.  We will keep you updated.

There has been a lot of consternation about fuel prices and the prospects for even higher prices over the summer.  What we are seeing is simply the equilibrium of prices for finished petroleum products on a world market.  The United States is no longer the main driver of the demand side of the equation.  China and India have billions of people using incrementally more finished petroleum products.  Stop and think for a moment about millions of people upgrading from bicycle and foot transportation to using a moped or mini-bike.  Then think about the millions of people who are going from a small motorized bike to a tiny “econo-box” car.  Even if used efficiently, you have incremental new demand.  The result is that while fuel demand is dampened in the United States, prices remain high because the global price for gasoline and diesel are high.  Get used to it!  It is interesting to hear complaints that refiners here in the U.S. are exporting fuel when it should stay here to lower prices here.  Markets do not work that way.  In fact, importing raw crude and refining it for export provides jobs and profits here.  Isn’t that what everyone wants; namely good pay for real value-add jobs?  If refiners cannot export fuel, then capacity will be reduced, jobs will be lost, and profits will go to another refiner somewhere else in the world.

On another note, my disdain for financial reporting is reaching new levels.  Now you know why I like to trade using technical analysis.  We would rather trade what is on the tapes rather than how we think things should be.  Right now you are hearing in the news about how the economic recovery is accelerating.  Hmmm… maybe.  But check out the Ceridian Pulse of Commerce Index by Ceridian and UCLA (http://www.ceridianindex.com/).  The index measures the consumption of diesel on a real-time basis.  Since diesel is literally the life blood of commerce, we believe the index is an accurate measure of how much real, current economic activity is actually happening.  The index has rolled over since bottoming out at the end of the official recession.  Interestingly, fuel consumption only recovered about half way to pre-recession levels before rolling over.  Note too, that Q1 of this year will show a negative quarter and will continue the down-trend that has been in place for year.  So reports of economic growth accelerating may be “greatly exaggerated.”  We doubt that somehow new large portions of goods are being shipped by magnetic levitation (sarcasm intended).  We suggest everyone pay attention to the facts because the noise can distract you.

Break on Through…

…to the other side!  Famous lyrics that fit our markets right now.  Two words:  Price rules!

Despite falling volume, despite non-confirmation of leading technical indicators, price has pushed up through resistance.  Not only did we close above the 1165 area, we tested it yesterday and are resuming the uptrend.  In our opinion, putting a little more money to work in equities would be ok.  It would be nice to see a deeper correction before adding any more allocation to stocks.  As long as RSI and MACD don’t deteriorate further, the new allocation to equities will stay in place.

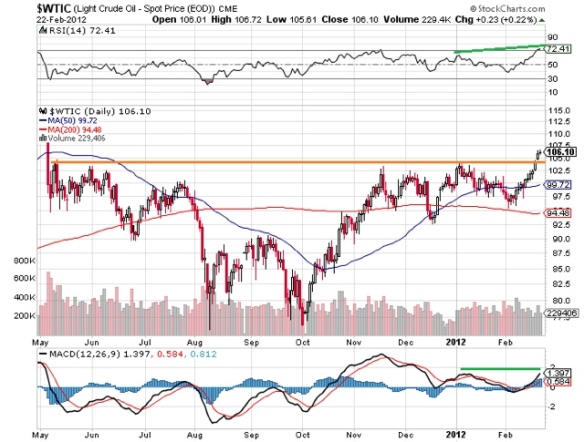
Oil is running up nicely again today!  Reversing the correction of the last 3 sessions.  As long as $103.50 area holds on $WTIC, we think oil can work its way up to over $115.00.  And the way oil moves, it might happen in a day!


Stuck in the Mud

Seems like since our blog last week the market has been stuck in the mud! And why wouldn’t it be with all the mixed news these days. However there are some very major technical reasons why as well.

The S&P 500 ($SPX) is still within the major resistance area around 1360. The top of the resistance area is the 2011 market high. The odds that some profits will be taken here, sparking a correction, are increasing. If we can break above, then the market can continue to rally.

We are concerned about the negative divergences that are more developed over the last week. Relative Strength, MACD and volume are continuing to weaken. Unless these indicators can be resolved soon, price might begin to follow. All in all, the probability of a correction is high, although not assured.

Oil has broken out above $105.50 area. This was a powerful move above resistance from early last year. We are bullish based on this move being accompanied by neutral or confirming indicators. It is possible oil corrects back to the resistance, closing the gap. There isn’t any technical resistance until around $115 per barrel, which was the early Libyan revolution oil price high from 2011. We think, without disastrous economic news, oil can climb higher.

20120223-093159.jpg

20120223-093230.jpg

Glass Ceiling

The stock market rally has stalled the last four sessions and  with this morning’s futures almost flat (As of 8:50am EST).  Can we break through what looks like a glass ceiling of price resistance?  Let’s look at some of other indicators for evidence.

Today I used my trading screen instead of the normally great charts at stockcharts.com.  We want to show you what we have on our screen during the day as we watch the price ticker move.  At the top of the graphic in white oval you will see three horizontal lines that represent price resistance points.  The lower of the three is the late July 2011 high, right before the approximate 20% correction in early August, 2011.  The next line up is the early July 2011 high.  The top line is the early May 2011 high, which was the price high for 2011.  The three price highs are close enough that we can consider them as one larger resistance area.  So far, we have failed this week to push up through these prices.

If the market can correct just a little here, clear out some profit taking, then a much healthier rally can continue.  If you notice the yellow parabola winding under the prices for the last 10 weeks, this is the 13 day moving average.  Not closing below this short  term moving average is not common.  Normal market price oscillations which dip below the 13 day moving average are normal.  Going this long without a correction has us worried.  The last time we experienced this was December 2010 through February 2011.  The rest of the year was very, very volatile!  Additionally, volume is still on a slow trajectory lower.  In fact, 3 trading sessions from the last few weeks have been the lowest volume recordings for a non-holiday in a decade.  Conversely, if we just push higher here, without a 2-4% correction, we think the market might be just setting up for a larger correction or a period of volatility like last year.

Oil has continued its consolidation in the price range of about $93 and $103 per barrel.  A break above this range would be very bullish, while a break below would be bearish.  Which ever way this resolves, we have a nice long base to sustain a move in either direction.  There is plenty of room within some widely followed indicators for prices to move up beyond $103.  Consumers won’t want to hear this, but investors will be pleased.  Our favorite energy investments are high dividend paying trusts, equities or index ETFs.  Collecting a growing stream of dividends takes the pain that we might feel at the pump away!